Interpreting iLearn (Moodle) Quiz Data
![]() One of the many advantages to using Moodle (iLearn) in addition to the flexibility of the Quiz module (the number attempts, shuffling questions, inserting variables into numerical questions) is the wealth of usable data you can glean from each quiz. Bryant science teacher Kelley Murphy has begun analyzing this data to help students learn. Here is an overview of some of the data and the possibilities it opens for teachers who administer assessments on iLearn.
One of the many advantages to using Moodle (iLearn) in addition to the flexibility of the Quiz module (the number attempts, shuffling questions, inserting variables into numerical questions) is the wealth of usable data you can glean from each quiz. Bryant science teacher Kelley Murphy has begun analyzing this data to help students learn. Here is an overview of some of the data and the possibilities it opens for teachers who administer assessments on iLearn.
Overall Data and Item Performance
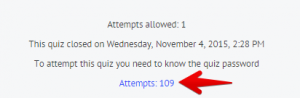 Clicking on the number of attempts from the quiz screen gives you preliminary data, including the student’s overall grade and their performance on each individual item. You can also see how long the student took in order to complete the quiz.

Statistics
Overall Statistics
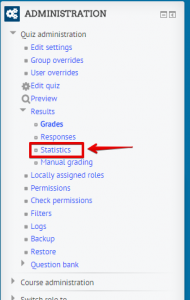 Click the “Statistics” link under Quiz Administration to open up more detailed data on the quiz. Quiz statistics will give you averages, including the averages on multiple attempts, standard deviation, score skewness and kurtosis, coefficient of internal consistency, and error ratio. All of these can be useful in determining the reliability of the assessment and the validity of inferences to which the data leads.
Quiz Structure Analysis
 Quiz structure analysis will also give data on each individual question. Individual question data includes the facility index and discriminative efficiency, which can help teachers determine the fairness of questions, as well as pinpoint deficiencies in understanding.
Individual Question Statistics
 Clicking on the name of each question yields even further data. In addition to summarizing the data from the previous screen, a teacher can view the breakdown of answer choices and inputs.
Data-Driven Instruction
All of this data empowers teachers to make solid, data-driven decisions in their instruction and helps them increase the quality of their assessments. Data from iLearn (Moodle) quizzes can enhance and focus PLC discussions and lead to identification of best practices.
For a quick-reference guide to interpreting test statistics, click here.